Structural Deepening
Preamble
I’m interested in examining aspects of Simon Wardley’s mapping framework1 in greater detail.
If you that don’t know the background to this, you can begin reading On being lost to learn more about it. Reading Chapters 2 and 3 will only take you an hour or so.
To me, the appeal of this mapping framework is that it views a business (model) as a directed graph evolving in a space over time. I think this has lots of advantages over other things we commonly refer to as business models - but more on my various motivations later.
In this first post we’re going to look at the notion of structural deepening - but first let’s start by having a look at a map.
The structure of invention
These series of posts are about the evolution of technologies, and the transitions between competing technologies in the context of a business.
This first post draws heavily on the work of W. Brian Arthur2.
The x-axis of a Wardley Map (Figure 1 below) displays the maturity of a technology over its life cycle. The maturity is divided into four stages; Genesis, Custom Build, Product, Utility3.
To start with, illustrated in Figure 1, we can see that a component moves from left to right as it matures. I will use the word technology and component interchangeably in this blog as a means to fulfill a purpose4.
Initially, on the lefthand side in the Genesis stage the component has to be created for the first time. At this stage we don’t have a full design but a proof of concept that demonstrates how we can create something that achieves a desired purpose.
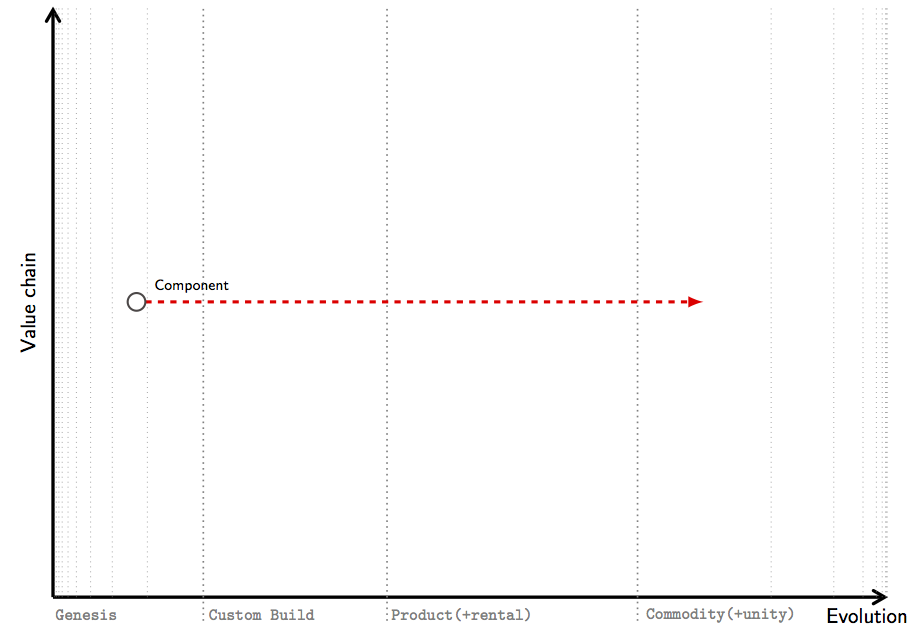 Figure 1. Map showing the evolution of a component through 4 stages, from Genesis to Commodity.
At the Genesis stage, a new component will have been kludged together from existing components or assemblies of existing components - a minimum viable prototype MVP if you will. For example, according to Arthur (2009 p. 131)5, the first cyclotron was assembled from parts that included a kitchen chair, a clothes tree, window glass, sealing wax and brass fittings!
The new technology, having proven its worth (at least in the mind of the originators)6, or having demonstrated that the harnessed principle is feasible, then begins its journey along a path of further development.
This is shown by an arrow going left to right in the Wardley Map. During this process the component matures (or evolves) from an initial working technology towards a state that is more reliable, more efficient and more robust. We develop a detailed understanding of its viable operating conditions and this enables us to better understand the cost of delivery and the value it can create.
The development (or evolution) of the component is ultimately driven by supply and demand competition in the market (or similar mechanism) at different stages of maturity. Along this journey the component technology is often altered and augmented in a variety of different ways.
Let us, for now, ignore the details of the demand and supply pressures of different markets. We can simply think of a component as existing in several different states over the duration of its evolution. This is illustrated in Figure 2, where we have shown a component in three states during its life-cycle. The initial working technology is in state C[1], at a previous time. C[2] is the current stage of the component and finally C[3] is an anticipated future state 3.
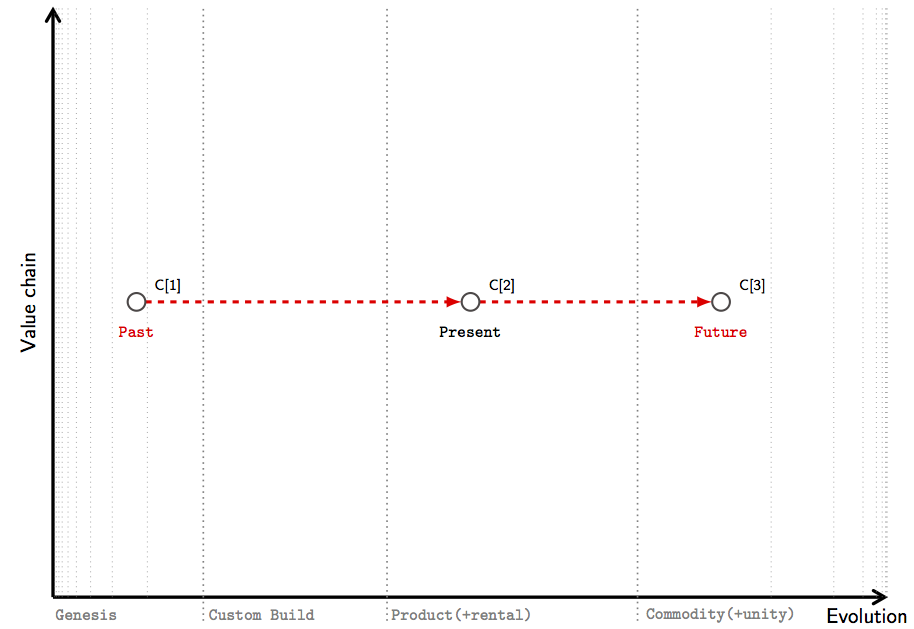 Figure 2. Evolution of a component from past to present to future through different realisations of the technology C[1] to C[3]. At each stage of development the technology must be made reliable, improved, scaled up and adapted to purposes. As we move from states 1-3, engineers can test better techniques, solve problems that have been encountered, and create performance improvements based on different operating conditions.
Purposed systems
Before discussing the behaviour of sets of components in more detail, lets us take a first look at the y-axis of the Wardley Map, labelled value chain 7.
Consider the example of the jet engine, illustrated in Figure 3.
The engine is designed to generate thrust to create flight to satisfy a user need. The engine enables us to harness thrust, a physical effect, caused from expanding combusting gas that creates a force we use for movement, the purpose - flying.
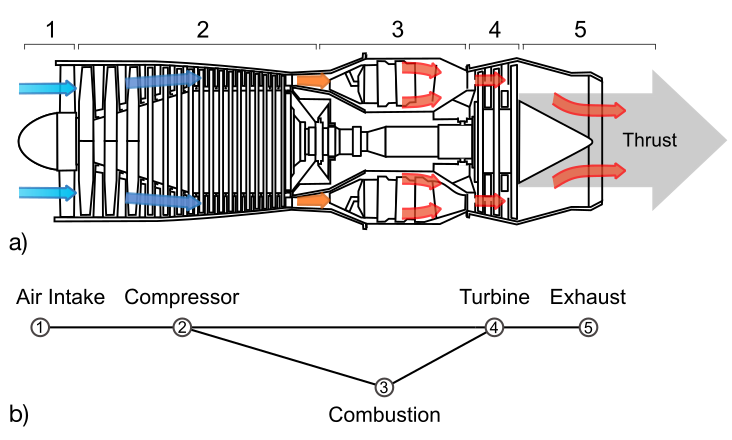 Figure 3. Example of a simple jet engine. a) Schematic of a jet engine showing numbered component. The engine consists of an air intake system, a compressor system (to compress the inducted air for combustion), a combustion system (to provide high-energy gas flow for the turbine), a turbine system (to drive the compressor and provide reactive thrust), and an exhaust section (Otis, 1997)8.b) A graph representation of the dependancy of different components. Note that Turbine drives the Compressor so we have cycles in the graph.
Observe that if we create a technology, we do so for a reason, a purpose. To achieve this purpose we harness a property of the world, a phenomena. Arthur’s use of the word principle refers to the idea of harnessing a phenomena for some purpose.(ibid. p. 2007) I interpret the y-axis of a Wardley Map as linking purposes, via principles, to phenomena. See Figure 4a.
We can arrange purposed systems in chains of dependencies starting with (user) needs. These needs might be personally or socially perceived - but they are the reason we created the component in the first place - and they sit at the top of the y-axis supported by a set of components and sub-components. It is the nature of technology that, at the end of this chain (or terminating branch) there is always a physical effect or a phenomenon that can be exploited to satisfy it.
Following Arthur (Arthur 2007 2) we can maintain that each system of components, or assembly of components, itself has a purpose - that task that it is designed to carry out. If not, it would not exist. Consequently, technologies are put together or combined from component parts or assemblies in a recursive manner9. This can be seen with Figure 4c where the engine component is comprises five further technologies and we have rearranged the graph of our engine from Figure 3b to a map in Figure 4c.
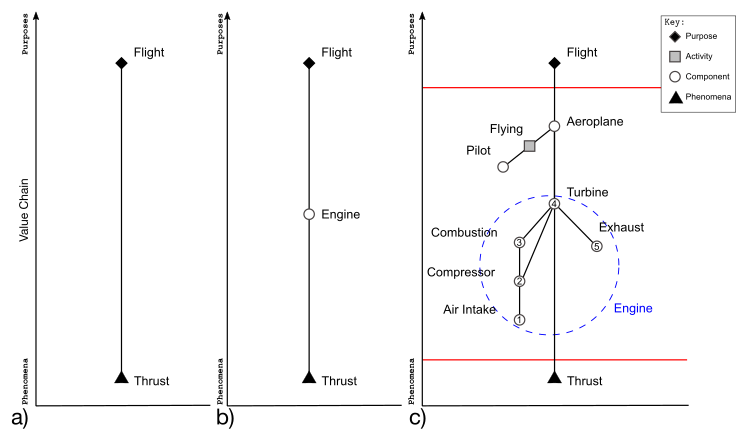 Figure 4. Example of a simple jet engine. a) The y-axis of the value chain linking a purpose (flying) to a phenomena (thrust). b) A technology component (an engine) using the principle of combustion to create thrust. It exploits the phenomenon that a mass expelled backward produces an equal and opposite forward reaction. c) The engine at a lower level of abstraction showing numbered components and their dependancies. The x-position of these components is for illustrative purposes 3.
Chains, or networks, or graphs of components are required to satisfy any suitably involved set of needs and therefore other sub-principles (and therefore sub-components) are required for a technology’s practical working. Therefore, as we descend on the y-axis in a Wardley Map we proceed from purposes, through needs and their satisficing assembly of components, to effects and phenomena.
Also, note that the phenomenon that are exploited need not only be physical and “any reliable or repeatable effect from nature, or logic, or behaviour, or organisation may be harnessed for use” (ibid. pp. 276).
In practise, we will frequently draw a map at a level of abstraction that does not contain purposes and phenomena (and their implied causal inter-dependancies), but focuses on a small set of components.
Systems of components
As with any real world map, a Wardley Map is depicted at a level of abstraction (and consequent level of detail) to be useful for a particular task. We have seen this briefly when comparing Figure 4b and 4c.
Components are put together or combined from other component parts to create assemblies9 of technologies. For our purposes, a map will mean looking at sets of components of specific technologies - and in any particular map some components will be included and some omitted.
If we go down a level, each of these components is in turn supported, supplied, monitored and controlled by other sub-components: “the compressor system requires a variable vane actuating system (to set the vane angles appropriately to airflow velocity), and an anti-stall bleed system to control pressure surges (the tendency of the compressed air to blow backwards); the turbine system requires a blade cooling system, and a complicated set of shrouds and seals to prevent high-pressure gas leakage” (Arthur (2007 p. 277)2).
This is illustrated in Figure 5. Our compressor component iterates from C[0] to C[1] with the addition of anti-stall and vane actuator components and the turbine from T[0] to T[1] with the addition of blade cooling and seals. Note that the relative position of C[0] to C[1] as the component moves to the right as the technology matures.
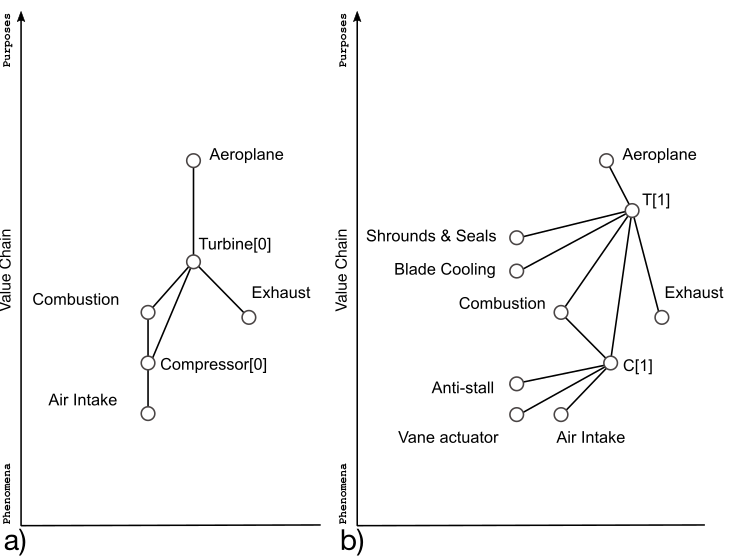 Figure 5. A slightly less simple jet engine. a) Our original representation of an engine. b) An engine at a later stage of development with additional sub-components. Note the evolution of components from left to right as the graph structure changes. For example the compressor transitions from C[0] to C[1], now including an anti-stall bleed system and a new version of the turbine design T[1]. The relative positioning of components on the x-axis and y-axis is for illustrative purposes. Note in these maps we do not distinguish between stages of development on the x-axis.
Focal technologies and the main assembly
Let us now turn to the question of what components to include on the map. The user need can be represented as a customer node at the top of the map. This is supported by a technology designed around the exploitation of some effect, as envisaged through some principle of use.
The method for achieving the purpose, through some main principle of use, will be referred to as the main assembly. This is illustrated in Figure 6a - and in principle the main assembly can include activities (other forms of capital) as well as technologies.
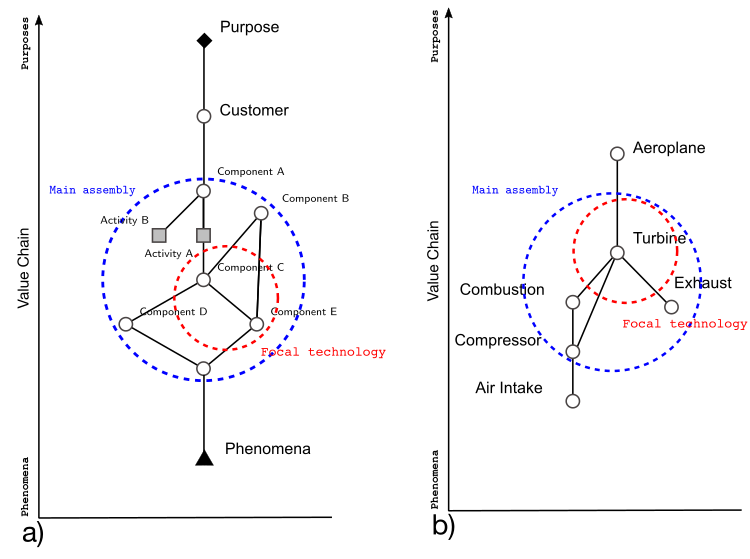 Figure 6. Purposed systems. a) Each component system has a purpose that can be thought of as a chain joining purposes to a principle to phenomena. b) Jet engine with indicative examples of the focal technology and main assembly.
In practice, the main assembly refers to a core set of components (or methods and activities) that successfully achieve the purpose and allows us to focus a map at the level of a specific task. Following Adner and Kapoor (Adner and Kapoor 201610) we identify the smallest functional component of the main assembly as the focal technology. The main assembly consists of the focal technology and other assemblies that support its working, regulate its function, and feed it with energy. These supporting assemblies require their own sub-components and sub-assemblies: controlling mechanisms, monitoring devices, input and output interfaces and so forth.
In this post we will not pay attention to the detail of the distribution (along the x-axis) of components that make up the main assembly - rather we will focus on the evolution of the main assembly itself from left to right in a manner similar to a single component illustrated in Figure 2.
In Figure 7, we illustrate the evolution of the main assembly for our gas turbine. We can see that it goes from states E[0] to E[1] across different stages of maturity. This is summarised in Figure 7b.
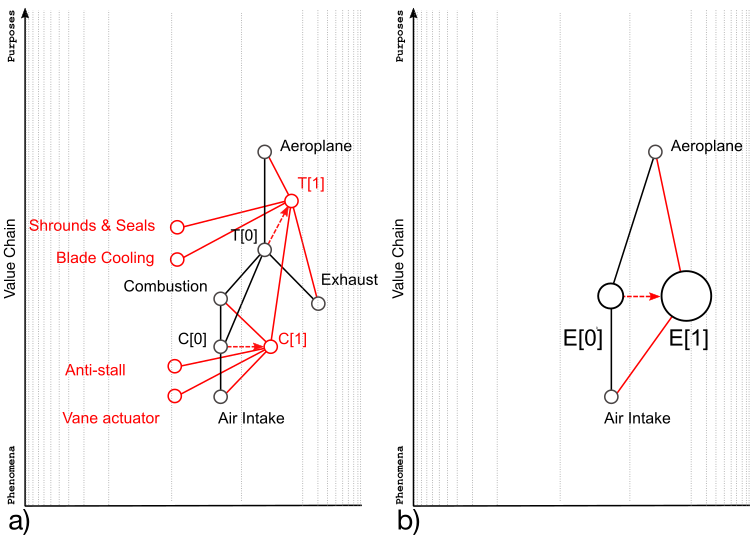 Figure 7. Evolution of the main assembly. a) Two versions of our gas turbine on the same map. Red dotted arrows show the evolution at a time i to i+1. b) A short hand summary of [a]. Note the size of the node representing the main assembly increases as the number of components increases.
With further maturation the technology begins to exhibit variations in deployed solutions and the assembly is subject to usual selection pressures of supply and demand. “The many versions of a technology improve in small steps by the selection of better solutions to their internal design problems… Technologies become more complex - often much more complex - as they mature.” Arthur (2009 p.132)5.
Structural deepening
One mechanism for the increasing complexity in the main assembly is structural deepening. This is where the performance limitations of the original main principle are overcome with the addition of other sub-principles (and therefore sub-components) to improve the envelop of the technology’s practical performance.
Adding sub-systems to work around such limitations drives technologies to elaborate as they evolve - and as sub-systems or assemblies themselves are technologies, and they too develop so they enhance overall performance.
As the engines are pushed to perform at higher temperatures the turbine blades soften as temperatures rise, so a component is added to create new airflow to cool the blades or a component that circulates a cooling material inside the blades themselves. This next stage of evolution is illustrated in Figure 8.
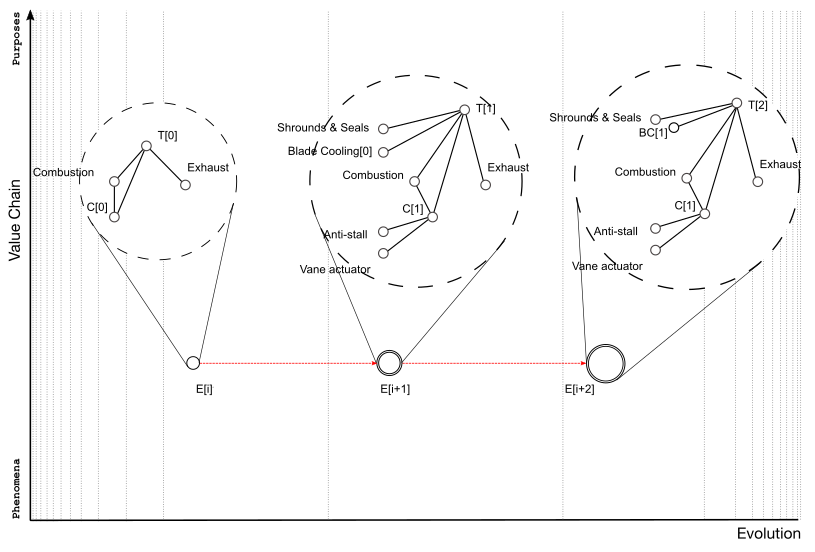 Figure 8. Evolution of the main assembly. Three stages of development E[0]-E[1]-E[2]. The three stages of the evolution of the main assembly are show as expanded detail with in dotted circles.
In complex interconnected, interdependent, economies an ongoing source of improvement is that many sub-components are shared across different main assemblies, and therefore a great deal of development happens as components evolve in other adjacent assemblies.
In some technology examples, the components of the main assembly are integral to the device itself. This is the for example in the case of the jet engine. In other cases, the components are external to a device but form part of the operating context or wider environment. Take the case of the alternatives to the use of the internal combustion engine for the car. Fuel cells, or similar, will not pose a real substitute until they are augmented by sufficiently rich set of complementary components that constitute a developed hydrogen infrastructure.
Armed with the notion of a main assembly we are going to look at the dynamics of technology substitution on a Wardley Map.
Summary
- Components evolve. (As do our purposes and our knowledge of phenomena.)
- Components can be combined to create purposed systems
- We can think of a system of technologies as chains of components from purposes, via the principles they embody, to phenomena.
- We can select a level of abstraction in a Wardley Map based on the identifying the focal technology and the main assembly.
- Structural deepening describes the observation that as the main assembly evolves it gets more complicated with the addition of components - left to right in a Wardley Map.
Where next?
We are interested in using a Wardley Map to look at the evolution of components. This allows us to think strategically about how a set of components can continue to provide support for a given purpose - or how they may be substituted as better alternative assemblies originate.
Next we’ll draw a key distinction between the as-developed performance of a focal technology, and the as-used performance of the technology which depends additionally on the components which must co-develop as part of the main assembly.
I’m going to try and use a few different technology examples, including photo-lithography and natural language processing (NLP).
However, before we get to that we’ll have to look at the y-axis again in a bit more detail! I’ll do this is the next post.
References
-
Wardley, S., Topographical intelligence in business, 2016 ↩
-
Arthur, W. Brian, The Structure of Invention, Research Policy, 36, pages 274-287, 2007 ↩ ↩2 ↩3
-
Following Wardley 2016, Figure 76, it is in principle possible to measure the stage of maturity of a component by assessing the language used to describe the technology in the various corpora that refer to it. From academic publications, to patents in the
Genesisstage, to technical standards documentation in the earlyProductstage and finally to marketing collateral, sales manuals and so forth at different stages of commercial development. Not all components need pass through every stage of development and I will ignore the details of measuring the x-position from corpora. It is assumed as given for now, including the number of stages, and I will write more on this in future posts. ↩ ↩2 ↩3 -
Following Arthur (2007 p. 276)2 The word technology has two other legitimate meanings: a body of practices, activities and components, and “the totality of the means employed by a people to provide itself with the objects of material culture” (Arthur, 2007, p. 276)2. ↩
-
Arthur, W. Brian, The Nature of Technology, Penguin Books UK, 2009 ↩ ↩2
-
Following Arthur (2007 p. 279) 2 I will call them originators, to avoid the lone eccentric connotation of “inventors”. The history of science has many examples of the co-discovery or rediscovery of similar ways to harness a phenomena for a particular purpose - something we will return to in a later blog post. ↩
-
There is ongoing discussion about the structure, and indeed necessity of, the y-axis in a Wardley Map (eg.Ditch it.). Whilst there is still a lot to be figured out (and this post skips over many nuances) I think of a map as a projection (mapping) from a high-dimensional space to a lower one. Most commonly we encounter this as going from a 3D real world to 2D cartographers map. Thinking of the 2D Wardley map as a projection into a lower dimensional space is useful - and we are likely to agree in due course on a definition and measurement process for a y-axis (or potentially multiple axes) that has broad utility - I am not in favour of getting rid of it! ↩
-
Otis, C., 1997. Aircraft Gas Turbine Powerplants. Jeppesen Sanderson Inc., Englewood, Colorado. ↩
-
W. Brian Arthur talks about the recursive structure of technologies, such that technologies consist of parts - assemblies or sub-assemblies - that are themselves technologies. ↩ ↩2
-
Adner, R. and Kapoor, R., Innovation ecosystems and the pace of substitution: Re-examining technology S-curves, Strategic Management Journal, 37: 625-648, 2016 ↩